


Microsoft Power BI and SAP Crystal Reports are two of the most widely used business intelligence tools around — but they’re built for quite different things, and choosing between them (or deciding whether to use both) is a question that comes up constantly in organisations of all sizes.
MS Power BI is a “business analytics service” that delivers business intelligence capabilities through a straightforward interface, letting end-users build their own reports and dashboards without needing a developer in the room. It integrates smoothly with Microsoft’s wider ecosystem and reports can be embedded directly in Teams, SharePoint, and websites.
SAP Crystal Reports, by contrast, is a desktop tool built for “pixel-perfect data reporting” — pulling from almost any relational data source and producing structured, precisely formatted output that can be accessed offline or online, from within applications, via portals, or on mobile devices.
Both are established, enterprise-grade tools. Both can deliver meaningful insights, surface actionable trends, and support day-to-day operational reporting. The question isn’t really which one is better — it’s which one is better for a given purpose.
What is Microsoft Power BI?
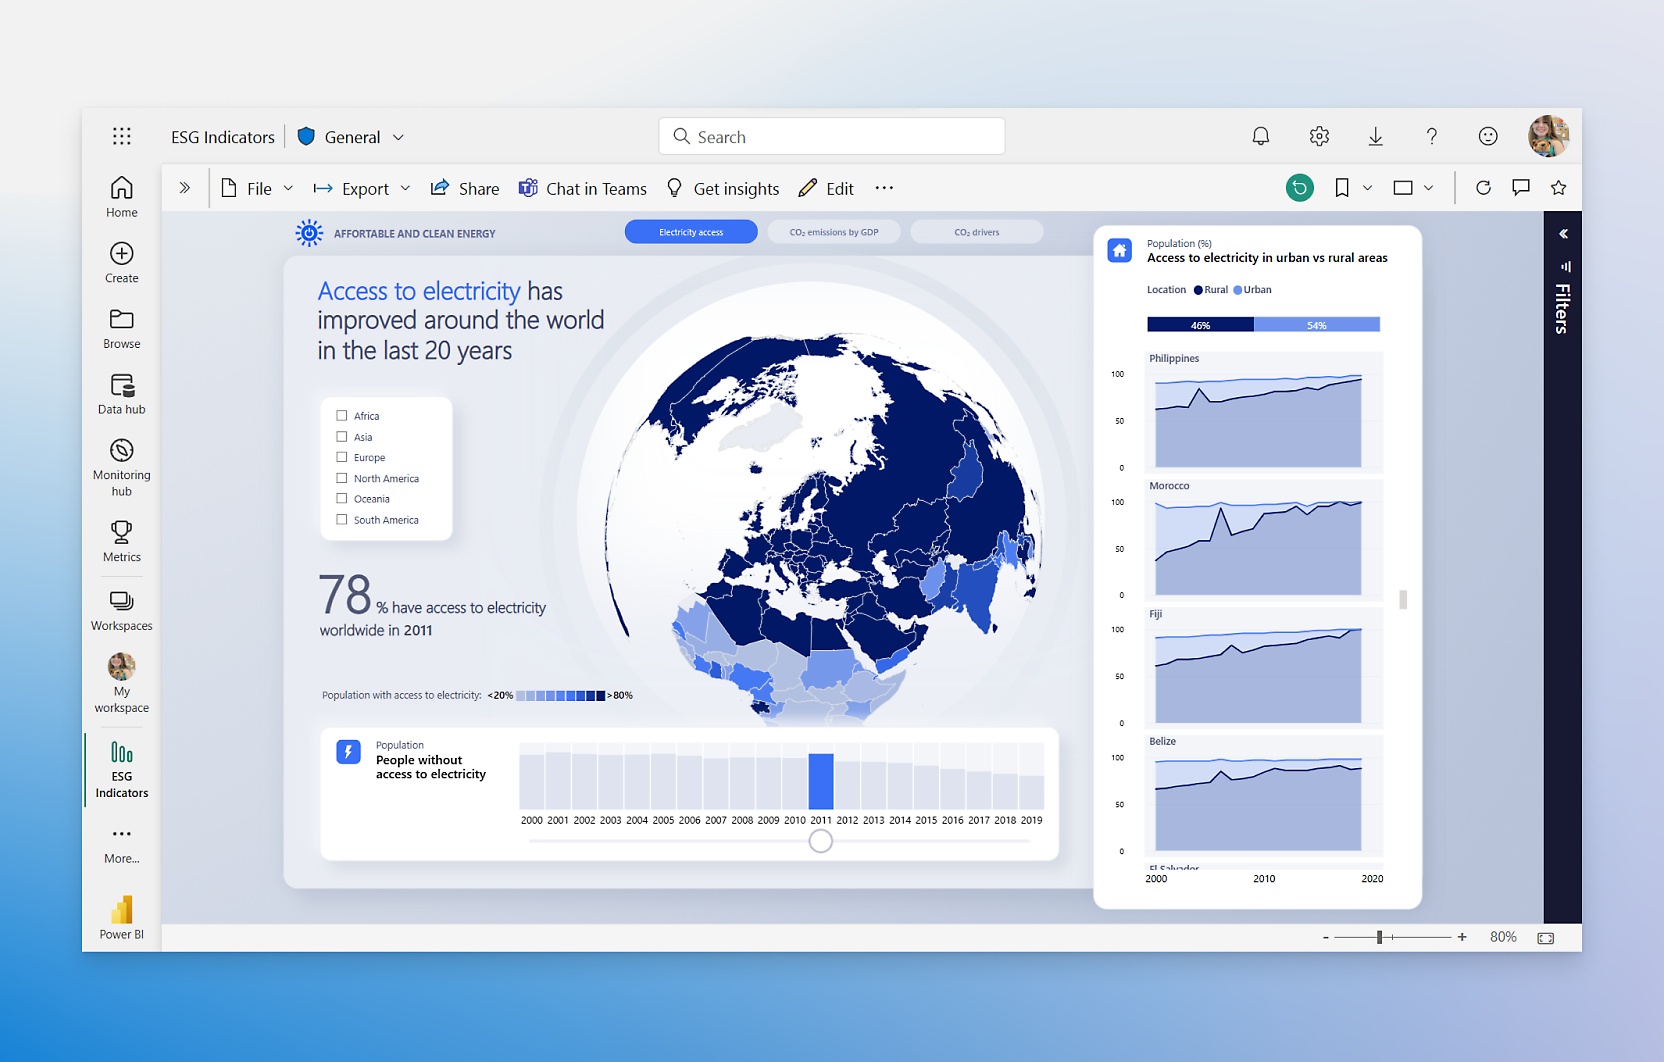
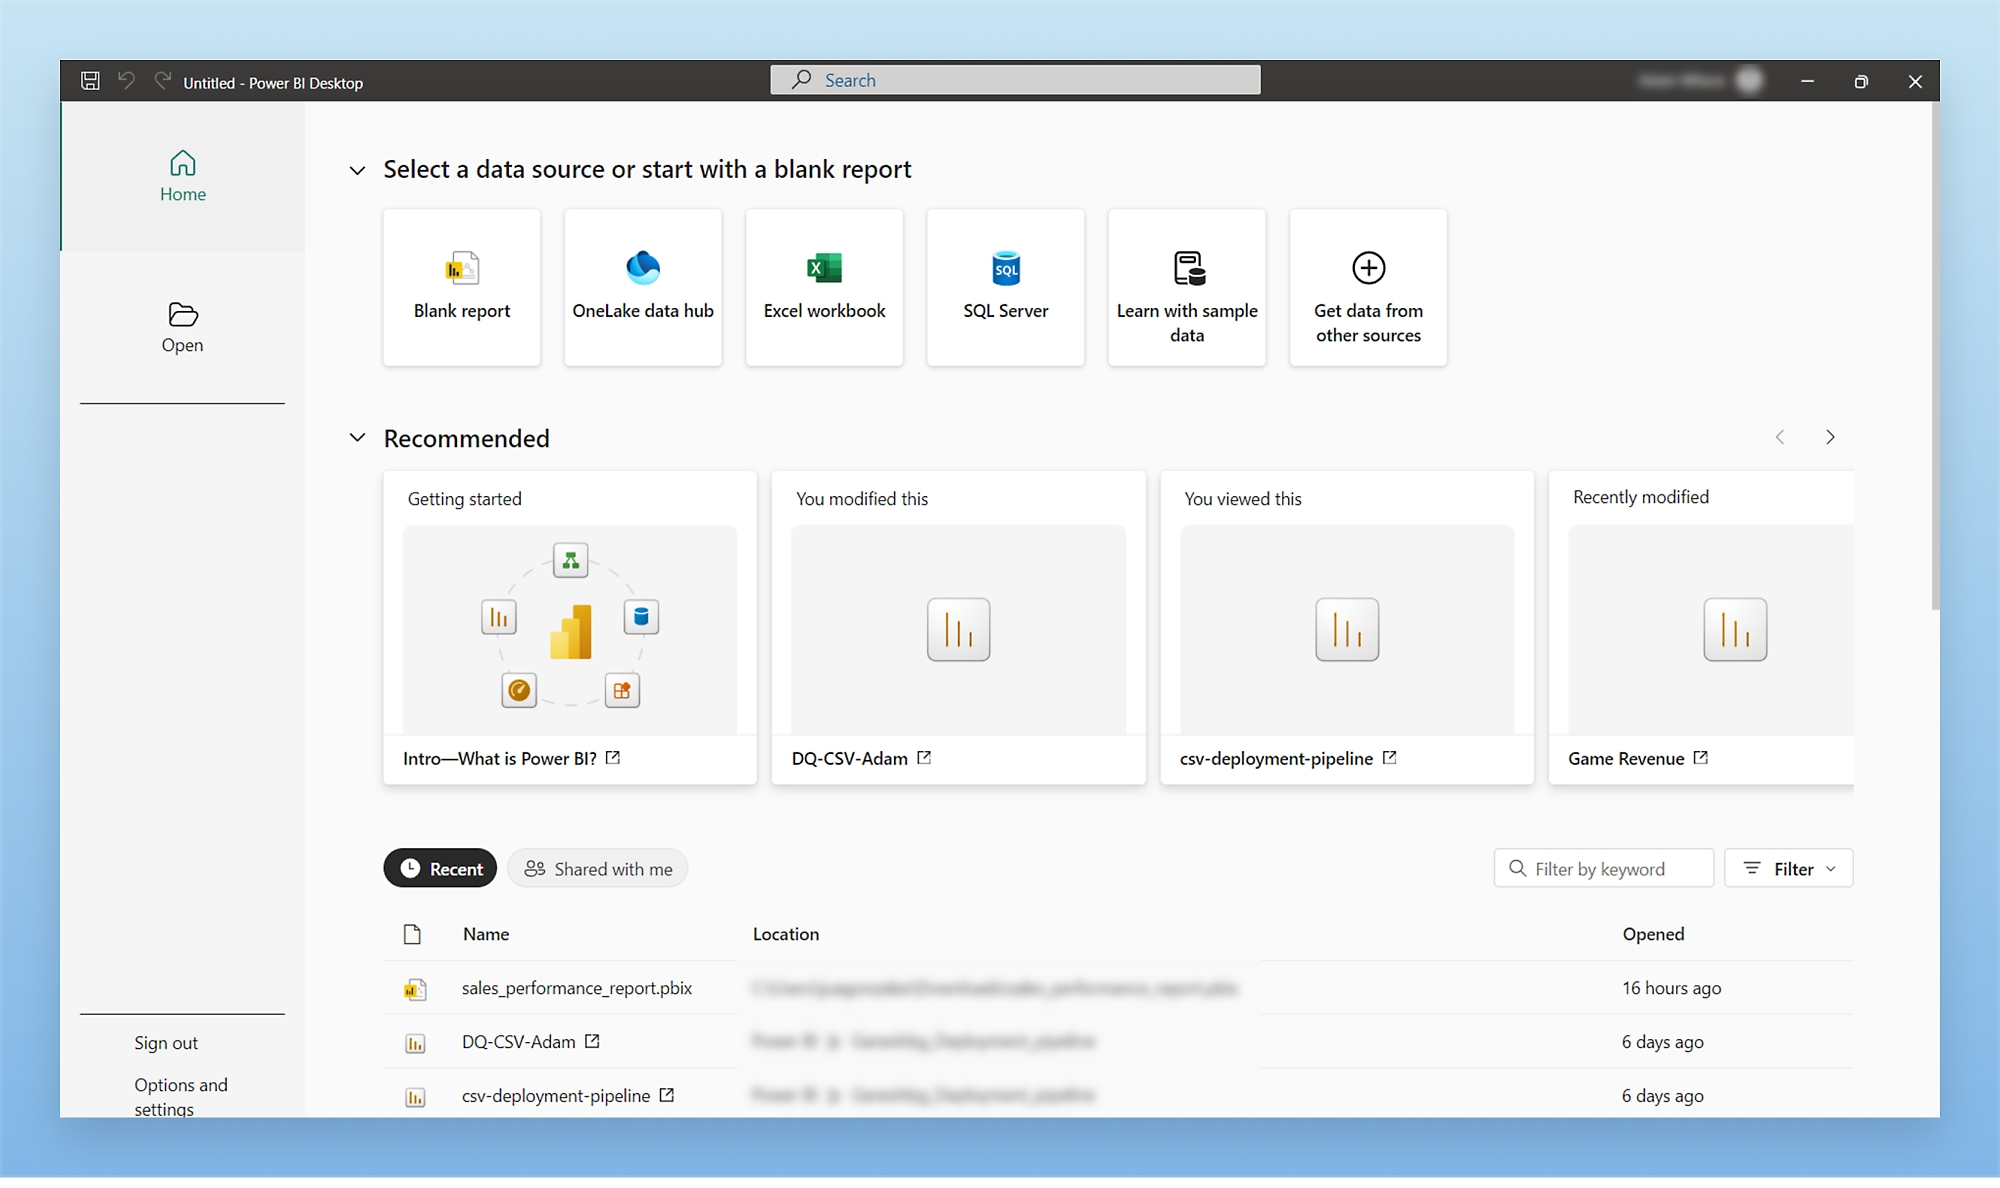
MS Power BI is a suite of tools packaged together in a single environment, designed to let organisations create reports and dashboards that analyse and share information across teams. End-users can connect to data sources directly, build and share data models, merge datasets, and present that data in flexible and visually appealing ways. The emphasis is on collaboration, exploration, and turning data into something that non-technical users can actually engage with.
The range of data sources it can connect to is one of its strongest selling points. Beyond the obvious Microsoft stack — Azure, Excel, SQL Server — it connects to Salesforce, Google Analytics, Zendesk, GitHub, Marketo, and hundreds of other third-party applications. Dashboards can be shared with colleagues directly or embedded into websites and other productivity tools, making it easy to get information in front of the right people without requiring them to log into a separate system.
It’s also worth noting the licensing model. Power BI is subscription-based, typically through Microsoft 365 or a standalone Power BI Pro licence. For organisations already deep in the Microsoft ecosystem, this often means the tool is available with little additional cost or procurement friction.
Power BI Benefits
On-Premise and Cloud Flexibility
Power BI can operate in a unified environment whether that’s local to your organisation or hosted in the cloud. The Power BI Report Server allows on-premise deployments for organisations with data residency or compliance requirements, whilst the cloud-hosted Power BI Service offers broader sharing capabilities and more frequent feature updates. Pre-packaged content packs and connectors ease the import of data from popular platforms.
Interactive Visualisations
The core of Power BI’s appeal is its interactive canvas. Charts, tables, maps, and custom visuals all respond dynamically to filters and slicers, and users can drill through from a summary figure to the underlying detail with a few clicks. This kind of exploratory, live interaction is genuinely different from traditional static reporting and opens up a different way of working with data.
Speed of Development
Using drag-and-drop mechanics, Power BI makes integrating and displaying information fast — far faster than building comparable output in traditional reporting tools. Natural language querying (through the Q&A feature) and AI-assisted visuals like Key Influencers and Anomaly Detection mean users can surface insights without needing to write a single formula.
Continuous Development
Microsoft releases updates to Power BI on a monthly basis. New connectors, visualisations, DAX functions, and features land regularly, and the product roadmap is publicly visible. For organisations that want a tool that keeps pace with the broader data landscape, this cadence is a real advantage — though it does mean keeping up with what’s changed.
Integration with the Microsoft Ecosystem
For organisations already using Microsoft 365, Azure, or Dynamics 365, Power BI sits naturally in that environment. Reports can be pinned to Teams channels, embedded in SharePoint pages, and connected to Azure data services with minimal friction. If your data lives in Microsoft infrastructure, Power BI is almost certainly the path of least resistance.
What is SAP Crystal Reports?
SAP Crystal Reports 2020 is the latest in a long line of versions stretching back to the early 1990s. It is a mature, stable, on-premise reporting tool designed for report developers and designers to connect to relational databases, extract data, and present it in a structured, precise format.
End users — or more typically, a BI developer or report designer — build custom reports to serve a wide range of purposes: operational data for warehouse teams, formatted letters to customers, board-level KPI summaries, pick lists for logistics, or interactive drill-through dashboards for portal users. The defining characteristic is control. Crystal Reports gives you fine-grained command over exactly how a report looks and behaves, page by page.
Licensing is a one-off purchase rather than a subscription, which is a meaningful distinction for organisations that prefer capital expenditure over ongoing operational costs. SAP Crystal Server extends the product’s capabilities into a managed, scheduled distribution environment.
Crystal Reports Benefits
Structured, Paginated Documents
Crystal Reports was built for paginated output — reports that need to look exactly the same every time they’re run, whether that’s a balance sheet, a delivery note, or a client statement. You have full control over page breaks, headers and footers, grouping, conditional formatting, dynamic visibility, and complex formula logic. If your reporting requirement is essentially a document rather than a dashboard, Crystal Reports handles it in a way that Power BI simply isn’t designed for.
Multiple Export Formats
Crystal supports exporting to PDF, Excel (XLSX), CSV, and Word, as well as printing directly — important for operational scenarios like mailing runs, pick lists, or anything that needs to leave the screen and exist as a physical or archived document. With SAP Crystal Server, reports can be scheduled to auto-deliver via email or drop to a file location on a set timetable, ensuring end-users always receive their data in the right format at the right time.
Developer-Friendly SDK and API
Crystal has a long-established SDK and API library that developers have used for decades to embed reporting capability into third-party applications. Crystal runtime licences allow organisations to distribute reports through their own software without requiring end-users to have their own Crystal installation. This embedded reporting use case is one Crystal has dominated for years, and many enterprise applications still rely on it.
On-Premise and Data Security
Crystal Reports is not a cloud product. Your data stays behind your firewall, processing happens on your servers, and there’s no dependency on an external service’s availability or pricing changes. For industries with strict data governance requirements — finance, healthcare, legal — this is often not just a preference but a compliance necessity.
Stability and Longevity
Crystal Reports has been in existence for over thirty years. It is embedded in a significant number of enterprise applications and critical business processes, and SAP continues to support it precisely because of how deeply it’s woven into organisations’ workflows. If you need a reporting tool that will behave consistently, won’t change unexpectedly, and has a vast community of experienced users behind it, Crystal Reports delivers that in a way newer tools simply can’t yet claim.

How Do They Actually Compare?
The honest answer is that these tools solve different problems, and pitting them directly against each other is a bit like comparing a Swiss Army knife to a scalpel. It depends entirely on what you’re cutting.
Data Exploration vs. Document Production
Power BI is built for exploration — you load data in, and users interact with it, filter it, drill through it, and find patterns. The experience is fluid and responsive. Crystal Reports is built for reproduction — you define precisely how a report should look, and it produces that output faithfully every time, whether it’s run once or a thousand times.
Self-Service vs. Developer-Led
Power BI leans towards self-service. A reasonably data-literate business user can build a meaningful report in Power BI without developer support. Crystal Reports, whilst not impenetrable to non-developers, is traditionally a tool where a report designer builds the template and end-users consume it. The gap between builder and consumer is more defined.
Live Interaction vs. Formatted Output
If stakeholders want to click around, filter by region, change a date range, and see charts update in real time — Power BI is the right answer. If they need a precisely formatted PDF that looks identical whether it’s printed today or in six months, and which might contain page numbers, grouped subtotals, and a company letterhead — Crystal Reports is the right answer.
Cloud-First vs. On-Premise
Power BI’s cloud service is where most of its value and development effort sits. Crystal Reports is fundamentally an on-premise product. If your organisation operates primarily in the cloud or wants minimal infrastructure overhead, Power BI aligns better. If your data doesn’t leave the building and you have local infrastructure to run software on, Crystal Reports fits naturally into that model.
Cost Model
Power BI operates on a subscription basis — typically per user per month through Power BI Pro, or capacity-based through Power BI Premium. Crystal Reports is a one-time licence purchase, with maintenance agreements available. Over a short horizon, Crystal Reports may look cheaper; over a longer one with a large user base, the comparison becomes more nuanced.
Can You Use Both?
Yes — and in many organisations, this is exactly what happens. They complement each other rather than competing.
Power BI might handle the executive dashboards, the ad-hoc analysis, the self-service reporting that empowers teams to answer their own questions. Crystal Reports might handle the operational output — the invoices, the statements, the scheduled reports that need to look exactly right and arrive in someone’s inbox every Monday morning.
There’s no rule that says you have to pick one. If the tools serve different purposes in your organisation, using both is a perfectly rational approach, and in our experience it’s often the most effective one.
Final Thoughts
MS Power BI and SAP Crystal Reports are quite different reporting tools — one designed for the modern, interactive, cloud-connected world of data exploration, and one a mature, trusted workhorse for structured document production. Power BI excels at ad-hoc reporting and the fluid exploration of data; Crystal Reports excels at static, formatted reports that need to be reproduced perfectly and reliably, time after time.
Both are world-class, enterprise-grade products with a legitimate place in modern organisations. Both will help you leverage your data to improve processes, efficiency, and profitability — just in different ways.
If you’re not sure which fits your situation, or you’re trying to work out how to get the best out of both, come and speak to Codestone. We work with organisations across a wide range of industries on their data and reporting strategy, and we’d be happy to help you find the right answer for your specific circumstances.