


SAP BusinessObjects is one of the world’s leading Business Intelligence (BI) platforms — a comprehensive software suite that enables organisations to access, manipulate, secure, visualise, and distribute their data.
The suite encompasses a wide range of tools, but for straightforward analytical reporting and visualisation, one stands above the rest: Web Intelligence, universally known as WebI.
This article covers what Web Intelligence is, how it evolved, what it can do, and why it remains a preferred choice for business users who want powerful reporting without depending on IT teams.
From Desktop Intelligence to Web Intelligence: A Brief History
Web Intelligence has been part of the BusinessObjects suite since the early 2000s. It was conceived as a successor to Desktop Intelligence — known affectionately as DeskI — which, as the name suggests, was a desktop-based reporting application.
WebI was originally envisaged as its web-based counterpart. Over time, however, the distinction blurred considerably. DeskI has now been fully phased out and replaced by WebI — to the point where there is today a locally installed, desktop-based version of Web Intelligence. The tool has come full circle, but with considerably more capability than its predecessor ever offered.
The output of a WebI report can be simple and throw-away, answering ad-hoc questions in seconds, or it can be sophisticated and permanent – complex recurring scheduled reports, well paginated, with logos and meta-data, sent direct to recipients’ email or file-shares. WebI can also do dashboards: interactive or automated, with onscreen filtering, hyperlinks between documents and drill-down through hierarchies.
Power over data is not limited to your skilled report-builders either, even report viewers can navigate through report structures, use input controls to change views, choose parameters and filter data. The output can be viewed in the SAP BI Launchpad web-app or as PDFs or spreadsheets. CSV or TXT files can also be created and exported if the data needs to be re-used elsewhere. Connectivity to MS Office documents or SharePoint is also a feature.
Connecting to Your Data: Flexible Source Compatibility
One of WebI’s most significant strengths is its ability to connect to a wide variety of data sources without requiring IT intervention for each new report. Report builders can connect directly to:
- SAP Universes (the semantic layer that simplifies complex database structures)
- SAP BW (BEx queries and InfoProviders)
- SAP HANA (in-memory, real-time analytical data)
- Microsoft Excel spreadsheets and CSV files
- Relational databases via direct connections
This flexibility empowers users to create data mash-ups — combining information from multiple sources in a single report — with minimal technical overhead. Think of it like assembling a spreadsheet from several different filing cabinets simultaneously, except the process is automated and the cabinets can hold millions of rows each.
How Easy Is It to Learn Web Intelligence?
The short answer: straightforward enough that business analysts can be productive within days. Codestone provide tailored WebI workshops spanning one, two, or three days, depending on the depth of knowledge required.
The report-building environment is drag-and-drop. There is no requirement to write code on the data side. For report design, WebI uses a formula language broadly comparable to Excel — reassuring for anyone already comfortable with standard spreadsheet functions.
For organisations deploying Web Intelligence for the first time, structured training accelerates adoption and reduces the risk of poorly designed reports that undermine data confidence.
Report Types: From Ad-Hoc Answers to Enterprise Scheduling
WebI covers a broad spectrum of reporting needs within a single tool.
Ad-Hoc and Self-Service Reporting
At its simplest, WebI lets a user pose a one-off question — “What were last month’s sales in the North region?” — and receive an answer in seconds, formatted as a table or chart. These reports can be discarded after use or saved for later reference.
Scheduled and Recurring Reports
At the more sophisticated end, WebI supports complex, multi-tab reports designed for regular distribution. These can be:
- Scheduled automatically on a daily, weekly, or monthly basis
- Formatted professionally with company logos, page numbers, headers, and metadata
- Delivered directly to recipients’ email inboxes or network file shares
This removes the manual effort of re-running and re-sending reports — a significant time-saving for finance, operations, and HR teams producing recurring outputs.
Dashboards and Interactive Documents
WebI is not limited to static reports. It can produce interactive dashboards with on-screen filtering via input controls, hyperlinks between documents for drill-through navigation, and drill-down through hierarchies — for example, from national totals down to regional and then branch level. This makes WebI a viable alternative to dedicated dashboard tools for organisations already invested in the SAP ecosystem.
Who Can Use Web Intelligence Reports?
An important distinction within WebI is the difference between report builders and report viewers.
Report builders design the structure, connect to data sources, write formulas, and configure scheduling. Report viewers, however, are not passive consumers. Even without building rights, viewers can navigate through report tabs, use input controls to change the data view, select parameters, apply filters, and export data in multiple formats.
This self-service capability reduces the burden on BI teams and enables business users to answer their own questions without raising a helpdesk ticket.
Reports can be viewed directly in the SAP BI Launchpad — the web-based portal that acts as the central hub for BusinessObjects content, accessible from any modern browser without local software installation.
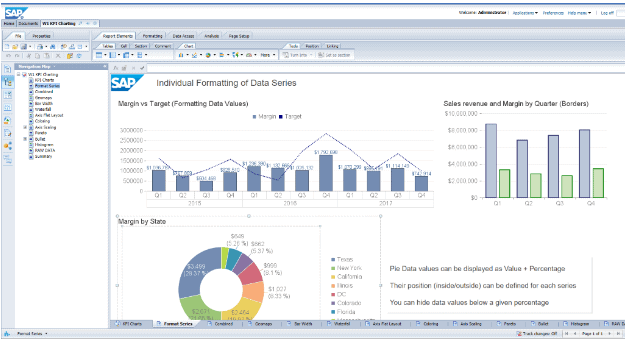
Visualisation Options: Beyond Bar Charts
WebI ships with a broad set of modern visualisation types out of the box, well beyond the standard pie and bar chart repertoire:
- Mapping for geographic data visualisation
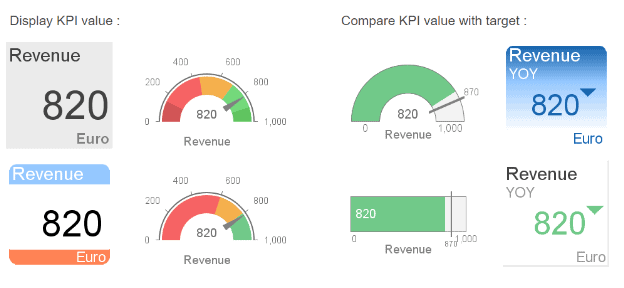
- KPI tiles for at-a-glance metric summaries
- Word clouds
- Box-plot charts for statistical distribution analysis
- Heat maps
- Gauge charts
- Traditional bar, line, area, and pie charts
Third-party plug-ins extend this library further. All chart types support bespoke colour schemes and fine-grained control over appearance, enabling branded, consistent report design across an organisation.
Scalability: From SMEs to Global Enterprises
WebI is architected to scale across a wide range of organisational sizes.
For enterprise deployments, WebI handles millions of rows of data without significant performance impact, supports hundreds of concurrent users, and works with databases distributed across global infrastructure.
For smaller businesses, SAP offers flexible licensing models appropriate for single users reporting against a local database — meaning organisations well outside the enterprise bracket are not locked out of the capability.
This makes Web Intelligence unusual in the BI landscape: genuinely useful at both ends of the scale spectrum, rather than being optimised for one at the expense of the other.
Thin Client vs Rich Client: Choosing the Right Mode
WebI operates in two modes, each suited to different use cases.
Thin Client (Browser-Based)
The standard web interface runs via HTML or Java and is compatible with all modern browsers — Chrome, Firefox, Microsoft Edge, and others. No local installation is required. This suits the majority of users who access reports periodically and do not need intensive editing functionality.
Web Intelligence Rich Client (Thick Client)
The Rich Client is a locally installed desktop application favoured by high-intensity report builders. It provides a stable platform for larger, more complex reports, does not time out during extended periods of inactivity, and offers enhanced performance for resource-heavy report design tasks. Organisations typically deploy a combination of both — thin client for viewers and occasional users, Rich Client for the core BI development team.
Frequently Asked Questions About SAP BusinessObjects v Web Intelligence
What is the difference between SAP BusinessObjects and Web Intelligence?
SAP BusinessObjects is the overall Business Intelligence platform — a suite of tools covering reporting, data integration, dashboards, and administration. Web Intelligence is one specific tool within that suite, focused on self-service report building and data visualisation. It is the most widely used reporting tool within the BusinessObjects ecosystem.
Do I need coding skills to use Web Intelligence?
No. WebI is designed for business users rather than developers. Report building uses a drag-and-drop interface, and calculations use a formula language similar to Microsoft Excel. No SQL or programming knowledge is required, though understanding your organisation’s data structure will always help.
Can Web Intelligence connect to non-SAP data sources?
Yes. Whilst WebI integrates natively with SAP BW, SAP HANA, and SAP Universes, it also connects to Excel spreadsheets, CSV files, and relational databases from other vendors. This makes it practical in mixed-technology environments where not all data resides in SAP systems.
How does Web Intelligence handle large volumes of data?
WebI is built to process millions of rows without significant performance impact. For very large datasets, connecting to SAP HANA — an in-memory database — can further improve query response times. The Rich Client version also handles large reports more reliably than the browser-based thin client.
Is Web Intelligence suitable for small businesses?
Yes. SAP provides flexible licensing options, including models appropriate for small organisations or individual users. WebI does not require large-scale infrastructure — it can run against a single local database, making it accessible to businesses well outside the enterprise bracket.