


Microsoft Power BI is an intuitive and easy-to-use tool for business intelligence analysts to pick up and start using with minimal learning required. It makes building datasets and merging data incredibly simple, and users quickly get the hang of importing data from many sources at once, joining them together and manipulating tables and columns.
However, the ease of use can be deceiving. Without a clear plan or strategy in place, users can create a jenga-tower of interconnected pieces that gets more and more unstable over time. Reports start lagging, refreshes take longer than they should, and nobody can quite work out why a perfectly reasonable-looking model is grinding to a halt.
This is where tools such as Tabular Editor start to be of use — analysing performance and highlighting where inconsistencies have bred or less-than-ideal construction has taken place. Think of it as a house surveyor, but for your MS Power BI datasets.
1. What is Tabular Editor?
Tabular Editor is a third-party software tool that can create and edit MS Power BI datasets outside of the MS Power BI Desktop application. It connects to your datasets and ingests their metadata to summarise form and function, as well as highlight any potential problems lurking beneath the surface.
The tool was originally built by Danish developer Daniel Otykier and has since grown into one of the most widely recommended tools in the Power BI community. There are two versions available: Tabular Editor 3, which is free and open-source, and Tabular Editor 3, which is a paid-for product with a richer feature set. For most teams just getting started, Tabular Editor 3 covers the vast majority of use cases you’re likely to encounter.
It includes a DAX (Data Analysis Expressions) editor where you can add or edit formulas to the model, as well as numerous tools for visualising data models, analysing queries and the speed of data access. The DAX editor itself is notably more capable than the one built into Power BI Desktop — it offers better autocomplete, inline error detection, and makes it far easier to work with complex measures without constantly losing your place.
Under the bonnet, Tabular Editor works directly with the Tabular Object Model (TOM), which is the metadata layer that describes how your dataset is structured. This is what allows it to be so quick — rather than loading all your data into memory, it just reads and writes the structure, leaving the actual data untouched.
2. Why Should I Use It?
The more you use MS Power BI Desktop, the more you will be tempted to add to a dataset. It is so simple to carry on piling more and more data into one model (as long as that data is related). At some point, however, you will reach a limit beyond which your model becomes unwieldy and slow to edit.
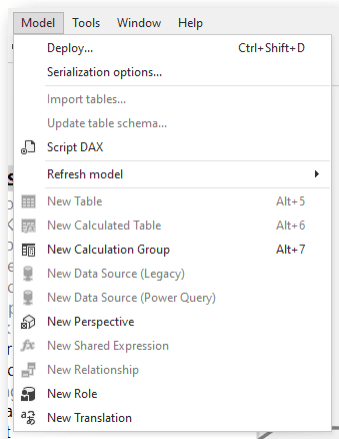 The Model menu in Tabular Editor
A data model in MS Power BI, when edited in the desktop tools, is a compressed in-memory database running on your PC or laptop. If you stretch the resources of your machine with too much data, too many calculated columns, or overly complex DAX statements, the responsiveness of the software will degrade. You might end up waiting minutes for something as trivial as a column rename operation — which is deeply frustrating when you’re trying to get work done.
At a basic level, Tabular Editor helps here because it works with the metadata rather than the data itself, meaning some editing tasks become immediately quicker the moment you connect it to your dataset. Renaming objects, reorganising your model, adding descriptions to measures — all of these feel snappy again.
But that’s not really the main reason to use it.
Performance Analysis
Tabular Editor integrates with VertiPaq Analyzer, a tool that gives you a detailed breakdown of the memory footprint of your data model. You can see exactly which columns are consuming the most space, where your cardinality is unnecessarily high, and which parts of the model are most likely causing slowdowns. This kind of insight is genuinely hard to get from Power BI Desktop alone, and it turns what would otherwise be a guessing game into something much more methodical.
It also works alongside tools like DAX Studio, which lets you run queries against your model and analyse how efficiently they execute. Together, these tools give Power BI developers a proper performance tuning toolkit — something the built-in software simply doesn’t provide.
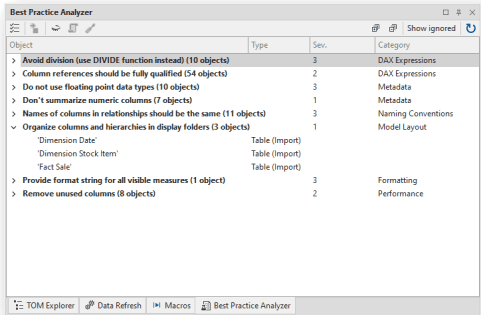 The Best Practice Analyser
Object Level Security and Perspectives
Object Level Security (OLS) and Perspectives are two features of MS Power BI that allow power users to control which consumers see which fields when creating or editing reports. These are important features in any environment where different teams or departments should only have visibility of certain data — finance shouldn’t necessarily be able to see HR figures, for instance.
The problem is that, so far, Microsoft haven’t implemented a way to create or manage OLS or Perspectives directly inside MS Power BI Desktop. Tabular Editor fills this gap. It gives you a clean interface for defining exactly which roles can see which tables and columns, and for creating Perspectives that simplify the report-building experience for end users by hiding irrelevant fields.
The Best Practice Analyser
One of the most useful features in Tabular Editor is the Best Practice Analyser (BPA). This runs a set of rules against your data model and flags anything that doesn’t comply. The rules cover a wide range of potential issues — things like measures that have no description, columns that aren’t being used anywhere, relationships set to the wrong cross-filter direction, or DAX expressions that could be written more efficiently.
What makes this particularly powerful in an organisational context is that the rules can be customised and standardised. Your BI team or administrators can define a shared ruleset that reflects your organisation’s standards, and every dataset designer can run the same checks. This keeps models consistent across teams and makes it much easier for someone else to pick up a dataset and understand it.
There is also a community-maintained set of Best Practice rules available on GitHub that covers many common pitfalls. It’s a good starting point if you’re setting up BPA for the first time and don’t want to build rules from scratch.
3. Tabular Editor and CI/CD Pipelines
One area where Tabular Editor really comes into its own is in deployment and automation workflows. Because it works with metadata files (specifically .bim files or the newer folder-based format), it integrates naturally with version control systems like Git.
This means your data model can be tracked alongside the rest of your code, reviewed through pull requests, and deployed via automated pipelines — the same way a development team would handle any other software project. For organisations that have invested in Azure DevOps or GitHub Actions, this opens up proper continuous integration and deployment (CI/CD) for Power BI datasets, which is a significant step forward in terms of governance and reliability.
Tabular Editor 3 in particular includes built-in support for scripting and automation, and its command-line interface makes it straightforward to incorporate into deployment scripts. If your organisation is serious about treating Power BI development professionally, this is one of the most compelling reasons to get it set up.
4. Who Should Be Using Tabular Editor?
It’s worth being clear that Tabular Editor isn’t aimed at casual Power BI users building a one-off dashboard. It’s most relevant to people who are regularly building and maintaining data models that other people depend on — BI developers, data engineers, and anyone responsible for managing a Power BI Premium or Fabric environment.
That said, even intermediate Power BI users will benefit from getting to know it. If you’ve been building in Power BI for a year or more and you’ve started running into performance problems or finding the Desktop tool sluggish, Tabular Editor 3 is free to download and can make an immediate difference.
For teams working at enterprise scale — managing multiple workspaces, enforcing row-level security, deploying across environments — Tabular Editor is less of a nice-to-have and more of an essential part of the toolkit.
5. How Does It Fit Alongside Other Power BI Tools?
Tabular Editor is part of a broader ecosystem of third-party tools that have grown up around Power BI to fill gaps left by the native software. DAX Studio is the other essential one — where Tabular Editor helps you build and manage your model, DAX Studio helps you understand how your queries are actually performing at runtime.
Used together, they give you a much clearer picture of what’s happening inside your model than Power BI Desktop can provide on its own. Many experienced BI professionals treat them as a pair and use both regularly.
There are also tools like ALM Toolkit, which is specifically designed for comparing and deploying datasets between environments, and Power BI Helper, which provides documentation and impact analysis. The community around Power BI tooling is genuinely active and innovative, and it’s worth keeping an eye on what’s available.
There are many other reasons to use Tabular Editor, but these cover the most impactful ones to help you get started. We’ll be looking in more detail at this and other tools over the coming months as we produce a series of blogs and webinars about Power BI and performance tuning.
If you’ve started using MS Power BI but hit a ceiling in your knowledge, or run up against a wall of performance problems, come and speak to Codestone. We’re more than happy to help knock down those walls and ceilings.
We’re experts in data, business intelligence and analysis solutions and can help with advice or resource to get you to your dream home of data.